
Coal-Based Activated Carbon Sourcing: Key Factors for Quality and Cost
2026-11-02
Choosing the right coal-based activated carbon supplier can make or break your filtration economics—yet many buyers still fixate on price alone, overlooking the hidden variables in raw coal quality, activation process, and post-treatment consistency. At Tundrr, we've seen how small sourcing decisions ripple into large cost differences and performance gaps. In this post, we break down the key factors—from iodine number and ash content to supply chain transparency—so you can source smarter without sacrificing quality or budget.
Iodine Number Is Not the Whole Story: What Else to Check Before You Buy
Iodine number gets a lot of attention because it’s easy to measure and correlates reasonably well with surface area in the micropore range. But relying on it alone can lead you astray, especially if the carbon will be used for larger molecules or in liquid-phase applications where mesopores and macropores do more of the heavy lifting. A high iodine number doesn’t tell you whether the pores are actually accessible to the contaminants you’re trying to remove, nor does it reflect factors like dustiness, attrition resistance, or how the material behaves during backwashing.
Before you buy, ask about the molasses number or methylene blue number—both of which give a better read on capacity for larger organic compounds. You’ll also want hardness and abrasion data if the carbon will be handled, transported, or regenerated; a product that crumbles easily will create fines, raise pressure drop, and shorten bed life. And don’t overlook moisture content, pH, and ash level, since these affect how the carbon performs in real systems, not just in a laboratory flask.
Another practical check is particle size distribution. If it’s too wide or skewed toward fines, you can get channeling and uneven flow. For vapor-phase uses, butane activity or carbon tetrachloride activity may be more meaningful than iodine number. In short, treat iodine number as one data point among several—and match the other specs to your specific process conditions.
Ash Content and Water-Soluble Impurities: How They Quietly Cut Your Yield
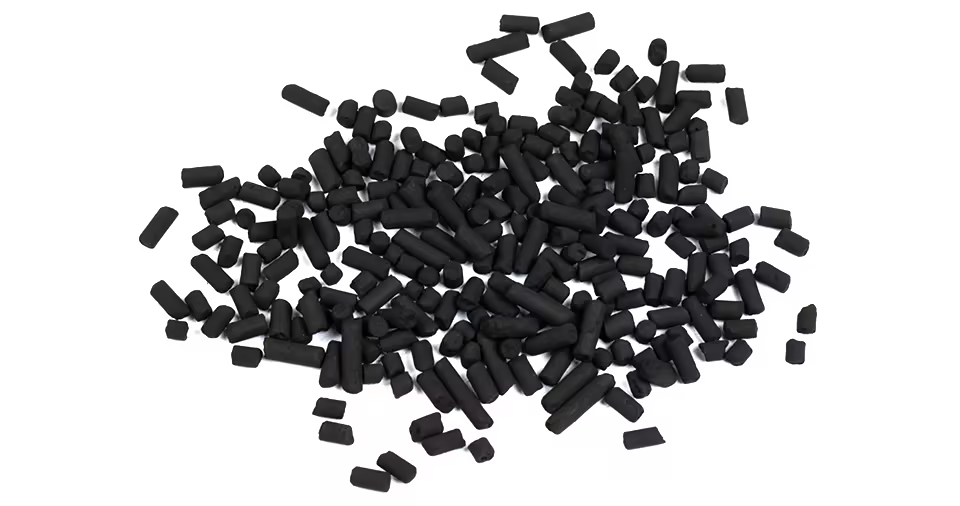
Every batch of raw material carries a hidden tax, and most processors never see it line by line. Ash content might sound like a lab curiosity, but it represents the non-combustible residue left after everything valuable has burned away. Water-soluble impurities are even sneakier—they dissolve during extraction or washing, then re-deposit as scale, sludge, or off-spec fines. Together, they quietly eat into your recoverable mass without ever triggering a visible alarm on the line.
The real loss isn't just the weight of the ash or the dissolved salts themselves. It's the downstream friction: filters clog faster, heat exchangers lose efficiency, pumps wear unevenly, and operators start compensating with higher temperatures or longer cycles. Those adjustments almost always degrade the target fraction—more thermal cracking, more side reactions, more product lost to volatility. A 2% increase in ash rarely shows up as a 2% yield drop; it often shows up as a 5% drop once you account for the extra handling and rework.
The fix isn't complex, but it requires sampling at the right point. Check the raw input before blending, not after. Measure water-soluble impurities on a dry basis so moisture fluctuations don't mask the trend. And track the ratio of ash to organic yield over time—if that ratio creeps upward while your incoming material looks the same, you're losing product to fouling and carryover, not to bad feedstock. Recognizing that silent drift is often the difference between a profitable month and a break-even one.
Hardness vs. Attrition Loss: What Really Happens After the First Backwash
When a fresh bed of filter media goes through its first backwash, the numbers can look alarming. A sudden spike in attrition loss is common, but it rarely tells the whole story. Much of that early material loss comes from loose surface dust, fractured edges left over from manufacturing, and irregular particles that were never going to stay attached. The backwash simply strips away the weakest links before the media settles into its working shape. Hardness tests done before installation often miss this because they measure a polished, ideal surface rather than the actual grain population with all its flaws.
Hardness, measured on the Mohs scale or through crush strength, is often treated as the main predictor of attrition resistance. In practice, the relationship is messier. A high hardness value can give a false sense of security if the particles are angular or contain internal microcracks from the production process. When those grains collide during backwash expansion, stress concentrates at the sharp corners and crack tips, producing fragments even though the base material is hard. Conversely, a slightly softer but more rounded media can show lower long-term attrition simply because it distributes impact energy more evenly. The first backwash is where these differences start to emerge, but they are not always obvious from a single data point.
After that initial purge, attrition loss typically drops and then levels off if the media bed is well matched to the flow conditions. The grains that survive the first backwash have already shed their weak projections, and the remaining particles tend to wear at a slower, more predictable rate. Operators who react too quickly to the first backwash reading may end up replacing media unnecessarily or adjusting backwash rates based on a transient spike. The real question is not whether hardness alone predicts attrition, but how the full particle size distribution and shape factor evolve after the first backwash. That is where the long-term performance story actually begins.
Particle Size Distribution: The Overlooked Lever for Pressure Drop Control
When engineers chase pressure drop issues, they typically swap media, tweak flow rates, or add filter area. The particle size distribution, however, often sits there quietly undoing those efforts. A narrow cut might seem predictable, but even a small shift in the fines fraction can pack voids differently and send resistance climbing.
The overlooked part is not just the median diameter. Two batches with the same d50 can behave completely differently if one carries a long tail of sub-10-micron particles. Those fines migrate into gaps, bridge between larger grains, or form dense cakes. The result is a pressure drop curve that looks nothing like the clean-bed calculation.
Paying attention to span, skewness, and the low-end tail gives a direct handle on hydraulic resistance. In many packed beds and filter cakes, cutting the fines by a few percent reduces pressure drop more than increasing porosity by the same margin. It's a lever that costs little but demands a closer look at the full curve, not just a single number.
Steam Activation or Chemical Activation? The Trade-Offs That Quotes Rarely Show
Activated carbon buyers tend to fixate on BET surface area or iodine number, but those figures say little about which activation route makes sense for a given process. Steam activation runs at 800–1000°C and uses water vapour to open porosity. It yields a carbon with a narrower micropore distribution and a mildly alkaline surface, which often translates into better gas-phase adsorption and lower ash leaching. The trade-off is poor yield: a significant portion of the precursor is burned away, and the pore structure shifts if the feedstock varies even slightly.
Chemical activation, typically with phosphoric acid or zinc chloride, operates at much lower temperatures and preserves more of the original carbon skeleton. The product is strongly mesoporous with acidic surface chemistry, making it suitable for liquid-phase decolorization, certain pharmaceutical cleanups, and high-capacity storage. What quotes rarely show is the washing burden. Residual acid or zinc must be rinsed out thoroughly, adding water treatment costs and complicating compliance where effluent limits are strict.
A further hidden variable is regeneration life. Steam-activated carbons generally tolerate thermal cycling better, while chemically activated grades may lose surface area after only a few regeneration rounds. If carbon is regenerated in place, the lower initial price of a chemical product can quietly evaporate over two or three cycles. Ask for regeneration data, not just fresh specifications.
The True Cost of Coal-Based Carbon: Why the Lowest Price Can Be the Most Expensive
A low sticker price for coal-based carbon rarely reflects the costs that arrive later. Higher ash content and variable porosity often mean more material is needed to hit the same treatment target, and spent carbon can be classified as hazardous waste depending on what it has absorbed. Those disposal and compliance burdens quietly shift the real expense onto the buyer.
Performance gaps also show up in systems that cannot tolerate fluctuation. Cheaper grades may have lower mechanical strength, causing fines and pressure drop problems in fixed-bed adsorbers, or they may lose capacity faster. That translates into more frequent changeouts, unplanned downtime, and higher labor costs, all of which erase the initial savings.
The financial picture gets worse when carbon pricing and tightening emission limits are included. Coal-based supply chains carry a heavier carbon footprint, and companies relying on them can face steeper regulatory exposure or lose contracts that require cleaner inputs. Factoring in these future liabilities makes the cheapest option the most expensive over the asset's life.
FAQ
Iodine number is often used as a quick indicator of micropore development, but hardness, ash content, and moisture are just as critical because they directly affect downstream handling and actual service life. Particle size distribution also needs to match the application, otherwise pressure drop or contact efficiency will suffer.
Different coal ranks such as bituminous, anthracite, and lignite vary widely in carbon content and volatile matter. High-grade anthracite produces harder, more durable carbon but commands a higher price; some bituminous coals can achieve decent adsorption capacity at lower cost if properly activated, though batch consistency requires tighter supplier control.
Yes. Beyond the unit price, consider ash leaching from pre-washing, breakage losses during transport and storage, spent carbon disposal fees, and downtime or rework caused by quality fluctuations. When these are spread across the actual amount of contaminant removed, the cheapest option often turns out expensive.
Steam activation tends to develop a more extensive micropore network suited for gas-phase adsorption; chemical activation with phosphoric acid is more common for wood-based carbon and less typical for coal. Temperature curve and residence time during steam activation shape the pore size distribution, so two samples with similar iodine numbers may perform quite differently in real selective adsorption.
Request third-party test reports such as ASTM D4607 for iodine number and ASTM D2862 for particle size, and pull samples from incoming lots. Ideally run a bench-scale or pilot test under your actual operating conditions, because a high iodine number on paper does not tell you whether the pore structure matches your target molecule.
Build a cost model that includes purchase price, attrition rate, replacement interval, and spent carbon handling. For example, supplier A may be 15% more expensive per kilogram but last 30% longer; if change-out labor and downtime are significant, the higher-priced carbon can win on total cost. Ask suppliers to provide reference service life data under similar conditions.
An overly broad distribution causes uneven bed pressure drop and can create channeling, reducing effective contact time; excessive fines increase dust and filtration burden. In liquid-phase applications, particle size affects diffusion path length; in gas-phase, it influences pressure drop and attrition rate. Choose a narrow distribution based on your reactor design.
Batch-to-batch iodine number swings above ±50 mg/g, sudden increases in ash content, large deviations in delivered particle size from the contract, refusal to provide traceable coal source documentation, or marked differences between lab samples and production lots all point to unstable raw material or process control.
Conclusion
Sourcing coal-based activated carbon demands more than a glance at iodine number. A high iodine value can mask poor pore size distribution, weak surface chemistry, or inconsistent batch quality, all of which directly affect adsorption of target contaminants. Ash content and water-soluble impurities are often overlooked, yet they quietly reduce usable capacity: ash occupies active sites, while soluble salts leach into the process stream, causing corrosion, fouling, or unwanted downstream reactions. Hardness and attrition loss deserve equal attention, because the first backwash often breaks brittle granules, generating fines that increase pressure drop and force premature replacement. Particle size distribution works the same lever; a tighter mesh range may control pressure drop but raises material cost, while an uneven spread creates channeling and inefficient contact.
Activation method also shapes both performance and hidden expense. Steam-activated carbon tends to be harder with a broader pore structure, but chemical activation can deliver higher surface area at the cost of residual chemicals and additional washing, often shifting the burden to wastewater treatment. These trade-offs rarely appear in a standard quote, which is why the lowest unit price can become the most expensive option. Frequent changeouts, longer downtime, higher energy for backwash, and disposal of spent carbon all drive total cost upward. A robust sourcing decision should be based on pilot testing, third-party lab analysis, and full lifecycle economics rather than a single specification or a cheap per-kilogram bid.
Contact Us
Contact Person: Ellen Zhang
Email: [email protected]
Tel/WhatsApp: +86(21) 2287 6756
Website: https://www.tundrr.com/en/